Joint Projects
Project 1
The long-period levels oscillations for the Batents and Norwegian seas, their causes and consequences
Grantee: Elena Filchuk, AARI
Theme of study: «The Analysis of the long-period level oscillations on Barents and Norwegian seas, research of the causes this oscillations and estimation of the probable variations of the level in the near future».
Introduction
The global warming and the anticipated sea level rise in the Arctic is expected to influence shoreline erosion, sediment transport, navigation conditions, oil and gas operations, hunting, and other human activities. In 1995, scientists participating in the Intergovernmental Panel on Climate Change (IPCC) concluded that potential projected impacts of the warming are a serious concern. The IPCC "best estimate" scenario for the world ocean (neglecting the Arctic) projects a sea-level rise of approximately half a meter by 2100, with a range of 15 to 95 centimeters.
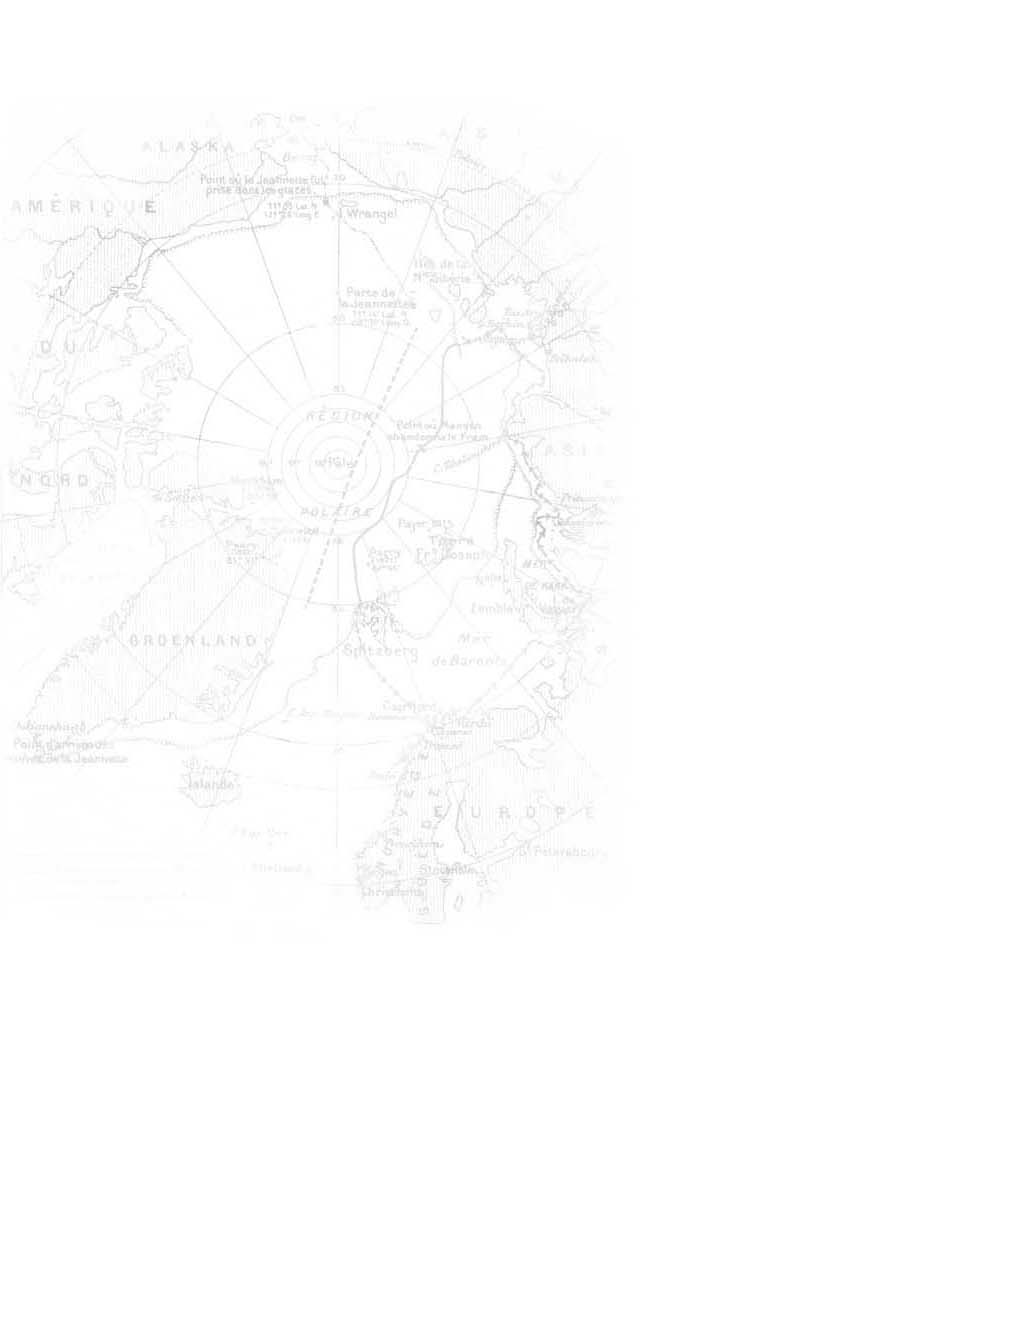
But what is the current rate of sea level rise in the Arctic Ocean and what is its cause? Solution of this question presents a complex scientific problem because observed sea level change, if we are able to observe it correctly, is the net result of a myriad of individual effects of dynamic and thermodynamic processes of terrestrial, oceanic, atmospheric, and cryospheric origin. A fundamental problem in determining of the rate of sea level change has been the lack of accurate data from sites along the Arctic Ocean coastline. Approximately 70 tide-gauge stations in the Barents Sea and Siberian Seas (Kara, Laptev, East-Siberian, and Chukchi Seas) have recorded sea level changes from the 1950s through 1990s (Table 1). Preliminary analysis has shown that over this 50-year period, most of these stations have a positive trend in sea level. The sea level data were collected by the Arctic and Antarctic Research Institute (AARI), St. Petersburg, Russia. These data sets have now been made available for analysis and the monthly mean relative sea level records for all gauges are now included in the Permanent Service for Mean Sea Level archive (http://www.pol.ac.uk/psmsl/pub/nucat.dat).
Data description
Instrumental measurements of sea level in the Arctic Seas began in the 1920s and 1930s. Stationary sea level observations were first begun in the Kara Sea (Dickson Island) in 1933, in the Laptev Sea (Tiksi Bay) in 1934, in the Chukchi Sea (Cape Schmidt) in 1935, and in the East Siberian Sea (Ambarchik Bay) in 1939. There were 71 stations involved in the sea level observational program in the mid 1980s. As a result of economical problems in Russia, many stations were closed in the 1990s, and at present, there are 21 operating stations in the Siberian Seas.
Sea level observations at these stations have been conducted according to the Manual for Stations and Gauges of the Hydrometeorological Service. The observations based upon manual readings have been carried out four times a day with an accuracy of 1 cm. Tide gauge stations have 1-hour frequency of observations, and 1 cm accuracy. Monthly data quality control includes visual data control and statistical control. Observations at some stations have had different locations in summer and winter, some of which were interrupted during replacement. Therefore much of the sea level data collected before 1949-1950 cannot be used because of the absence of a reliable geodetic survey. All stations shown in Table 1 have one or more geodetic benchmarks installed on stable ground. Periodic (usually annual but for some stations every summer month) geodetic surveys are made to each gauge to determine if any vertical changes in the gauge mount have occurred.
The monthly sea level data are calculated using daily sea level data. The monthly data based on four measurements per day are very close to the observations made at 1-hour intervals. It is estimated that the error does not exceed 2 cm with a probability of occurrence of 99.7%. The annual sea level based on 4-hour interval observations coincides with results based on 1-hour observing intervals.
Monthly mean relative sea levels were provided by the Arctic and Antarctic Research Institute for 71 stations located in the Barents and Siberian Seas. The time series of sea level variability generally cover the period between 1948 and 2000 but temporal coverage differs significantly from station to station. Table 1 shows the names and coordinates of all available stations. In addition to the names and locations, start and end years, number of years with observations, and number of months in the year with observations from each time series are indicated.
Background
Different aspects of Arctic sea level variability, extending from tidal to decadal time scales, have been investigated by different scientists for different time periods based on the sea level data contained in the recently released Russian archive. Pavlov and Pavlov found that in the 1980s a dramatic acceleration of the sea level rise (3-5 times more than in previous decades) had occurred. Pavlov later suggested that the major cause of this phenomenon was a change of the thermohaline circulation. In contrast, Proshutinsky et al. found that the sea level rise in the Arctic Ocean during this period could be explained by changes in atmospheric circulation associated with a change in the barotropic ocean circulation (it became more cyclonic), a decrease in SLP (inverted barometer effect), and an increase in precipitation and river runoff.
Miller and Russel have published results concerning the freshwater and salt budgets of the Arctic Ocean estimated by application of global climate model. Two 150-year simulations were employed on the basis of which to examine how this balance might change if the quantity of atmospheric greenhouse gases (GHGs) were increased. Relative to the control, the last 50-year period of the GHG experiment suggests that the total inflow of water from the atmosphere and rivers combined would be expected to increase by 10%. They also noted that the salinity would decrease, the sea-ice cover would decrease, and the total mass and sea-surface height of the Arctic Ocean would increase.
On the basis of this discussion it is clear that there is disagreement among the different investigators as to the observed rates of sea level rise in the Arctic Ocean and as to the cause(s) of the phenomenon. The problem is that different scientists employ different data sets and focus upon different time periods for data averaging, statistical analysis and modeling.
Project 2
Reconstruction of an annual drain values rivers of Gronfjorden basin, West Spitsbergen using the rivers-analogues
PI from AARI: Dr Mikhail Tretyakov
Research plan
Studying of a water regime of glacial areas, water exchange between glaciers and environment and formation processes of a drain and its fluctuations, influence of glacial waters on rivers regime with a glacial feed is very important hydrological task.
The river drain is one of the major environmental components. Rendering essential influence on many processes in environmental complexes, the drain depends on components comprising these complexes.
The Task: Reconstruction of an annual drain values of river basins of Gronfjord (West Spitsbergen) with use of rivers analogues method.
Using available long-term drain supervision, the reconstruction technique values of annual distribution of a drain of the rivers of Gronfjord watershed will be developed. Calculation of annual drain distribution represents a quantitative estimation of drain distribution on year seasons and months, and also on 10-days period and weeks inside month.
Reconstructed lines of an annual river drain of Gronfjord watershed will allow us to look after changes of water regime in an inter annual cross section and also to predict various variants of environmental events depending on climatic changes.